From: zerohedge
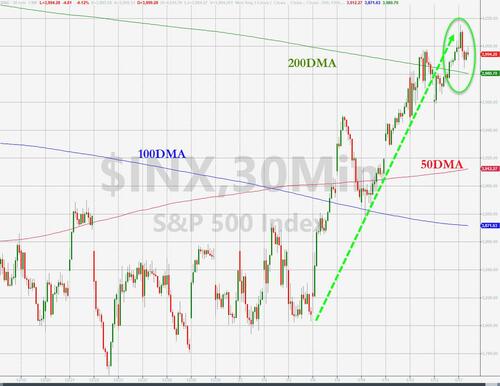
The S&P 500 has broken above (and is holding for now) its 200-day moving-average, with the Maginot Line of 4,000 seeming like a magnet.

But, while stocks are soaring ‘hopefully’, bond yields are declining ‘pessimistically’ and the yield curve is inverting ‘depressionarily’ (if that’s a word)… and that, as Nomura’s Charlie McElligott highlights is the largest market disconnect right now.
This pricing of a “US recession” scenario – which currently would see Fed “terminal rate” peak @4.92% in early / mid Summer, before forcing the Fed to CUT ~50bps by Dec23 and ~200bps by Dec24…
…versus increasingly sanguine “goldilocks” outlook which could see the Fed land the plane successfully, as inflation rapidly normalizes against US Labor remaining strong and able to offset the legacy tightening which has already occurred…
…in addition to “green shoots” for growth around the R.O.W. from Europe to Japan to China
“US Recession” scenario – massively inverted yield curve…
“Goldilocks” – financial conditions easing dramatically relative to monetary policy…
We have seen this kind of optimistic market decoupling before… and it did not end well for stocks that time…
McElligott suggests SFRM3-Z3 steepeners to play for a removal of some of those 2H23 cuts because growth is just more solid than is being reflected…
As McElligott notes, almost across the board, the Macro worst case scenarios “Left Tail” distribution of outcomes is being repriced lower while simultaneously, the “good” outcomes of “transitory” / “goldilocks” / “soft landing” picks up Delta…
The potential set of “things that could go really wrong” are NOT realizing at this juncture but, as SpotGamma notes, the recent rampage higher in stocks has reignited demand for ‘downside’ protection (as opposed to the recent ‘upside’ crash chase) because investors finally have positions on that require ‘hedges’ again.
Below SpotGamma plots the change in SPY calls (top) vs puts (bottom) from Thursday to Friday, and as you can see the addition of put positions far outweighs the addition of calls.
Our data suggests that calls, particularly short term, were sold and that post-OPEX puts were bought.
You can also see some skew readings picking up, such as SDEX, which backs the theme of traders starting to purchase puts and/or selling calls.
The bottom line tactically is that we look for trades that play mean reversion this week, off of 4000 area resistance and 3900 support.
Finally, more strategically (and technically), Nomura’s McElligott note that this technical US Equities “Breakaway Momentum” measure is getting a lot of client notice, so he ran the backtest “when 10 day NYSE Adv / Dec Ratio > 2.16 (99.8%ile)
Only happened 14 times since 1962, with the last 3 x’s being Jun 8 2020, Jan 9 2019 and Jul 12 2016…and simply posting some outrageously BULLISH SPX fwd returns out 6m / 12m with high ‘hit’ rates:
- 6m SPX median return +14.4%, 100% hit rate
- 12m SPX median return +20.0%, 92% hit rate
But, bear in mind that the January OpEx wipes away a big chunk of gamma, and SpotGamma think that volatility therefore expands (i.e. unpinning) into the end of January.
The combination of low IV into the OPEX “release” suggests long Feb expiration puts are now worth consideration.


